Our dataset, cran_packages.csv, is collected by the available.packages function. The utils package in R provides this function as part of its set of utility functions. The author of this package is in the R core team who contribute to the development and maintenance of the R programming language.
The dataset includes details about packages currently available at one or more repositories. The list of packages is obtained by downloading it over the internet or copying it from a local mirror. The data is given as a matrix, which consists of 20113 rows and 17 columns. The columns include information such as “Package,” “Version,”Depends,” and “Repository.”
The frequency of updates is 1 hour. Although there are no particular concerns about the data, we may need to note that the default behavior of the function includes reporting only packages whose version and OS requirements match the running version of R, and it provides information only on the latest versions of packages.
In addition to this, we collected the total number of downloads for each package between January 1st, 2013 and November 29th, 2023 using cranlog API. Collected data is merged with cran_packages.csv. This update to our main csv is will be done periodically via github actions. For now, we are using data collected as of 29th Nov, 2023.
2.1 Description
Our research aim is to provide a comprehensive understanding of the factors influencing package popularity and characteristics within the ecosystem. We will investigate it through the following 3 sub-questions:
Dependency Analysis: How do package dependencies (Depends, Imports, LinkingTo) influence the popularity or adoption of R packages?
Licensing Trends: What are the prevailing trends in package licensing within the R ecosystem?
Maintainability of Package: How version updates correlate with other package characteristics, such as the number of dependent packages and suggested packages, and the total number of downloads.
In addressing the first research question on dependency analysis, we will conduct a thorough data exploration to identify packages with the highest number of dependencies and analyze the distribution of packages based on the type and number of dependencies. To visualize these relationships, sankey diagrams and network graphs will be created, offering insights into the interconnectedness of packages.
For the second research question concerning licensing trends, our analysis will involve calculating the distribution of different license types and examining how the type of license affects the popularity of the package. We will use a bar chart to show the distribution of the license and ridge plots to show the difference in popularity for each license.
Lastly, the third research question about maintainability of R packages, we will explore how version updates correlate with characteristics like the number of dependent packages, suggested packages, and total download counts. Using a correlation heatmap, we aim to visualize these relationships, identifying potential associations between aspects of package versions such as dependencies, suggested packages, required R version, and download counts.
2.2 Missing value analysis
Code
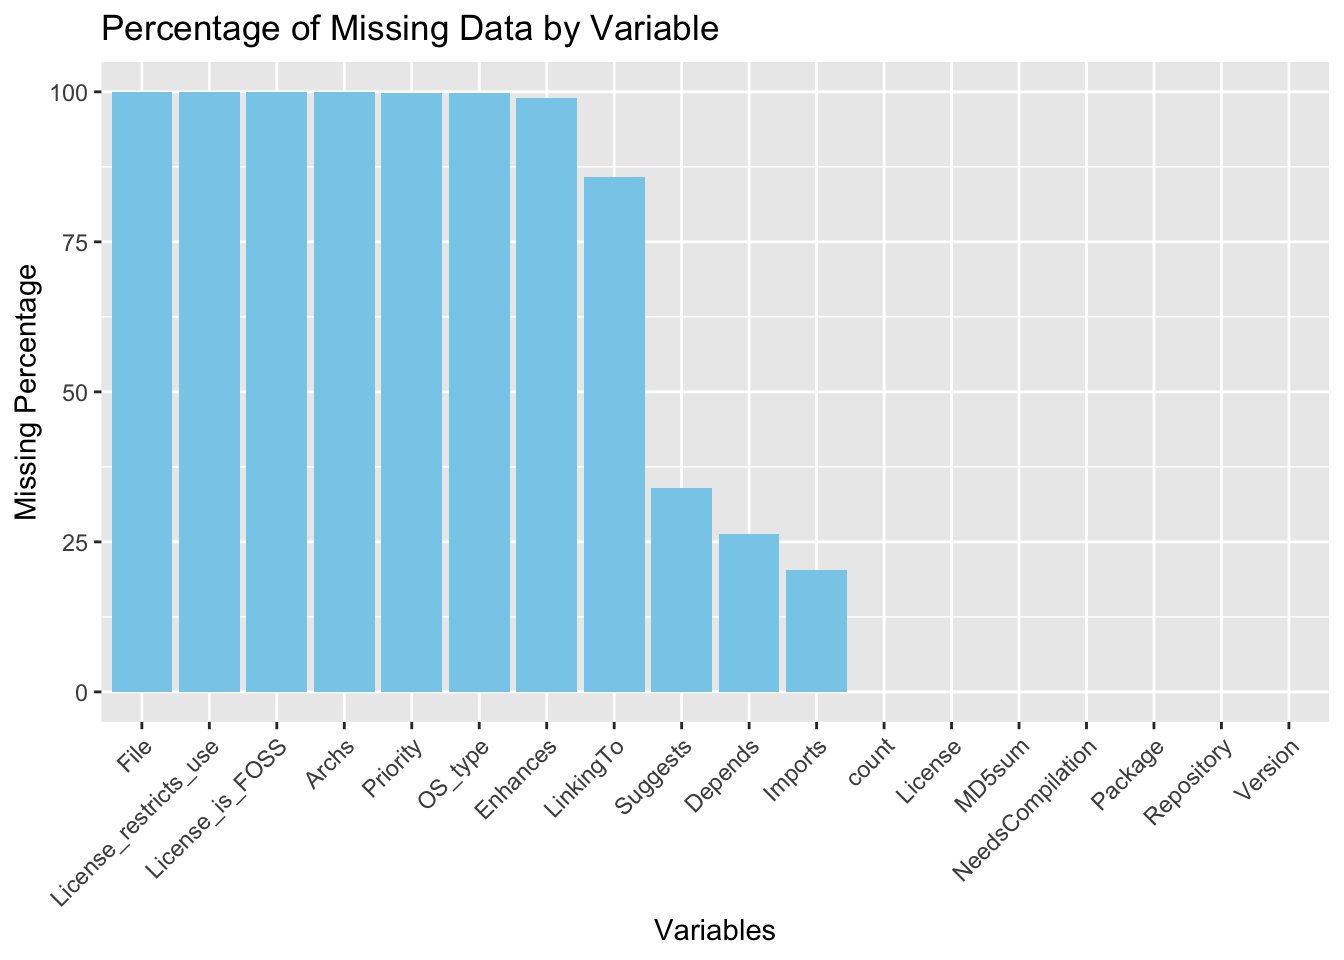
suppressMessages(library(ggplot2))suppressMessages(library(dplyr))suppressMessages(library(redav))df =read.csv("./assets/cran_packages.csv")missing_percentage <-colMeans(is.na(df)) *100missing_df <-data.frame(variables =names(missing_percentage), missing_percentage)ggplot(missing_df, aes(x =reorder(variables, -missing_percentage), y = missing_percentage)) +geom_bar(stat ="identity", fill ="skyblue") +labs(title ="Percentage of Missing Data by Variable", x ="Variables", y ="Missing Percentage") +theme(axis.text.x =element_text(angle =45, hjust =1))
As you can see, for the first 7 variables more than 99% of rows are missing them so we dropped these columns.
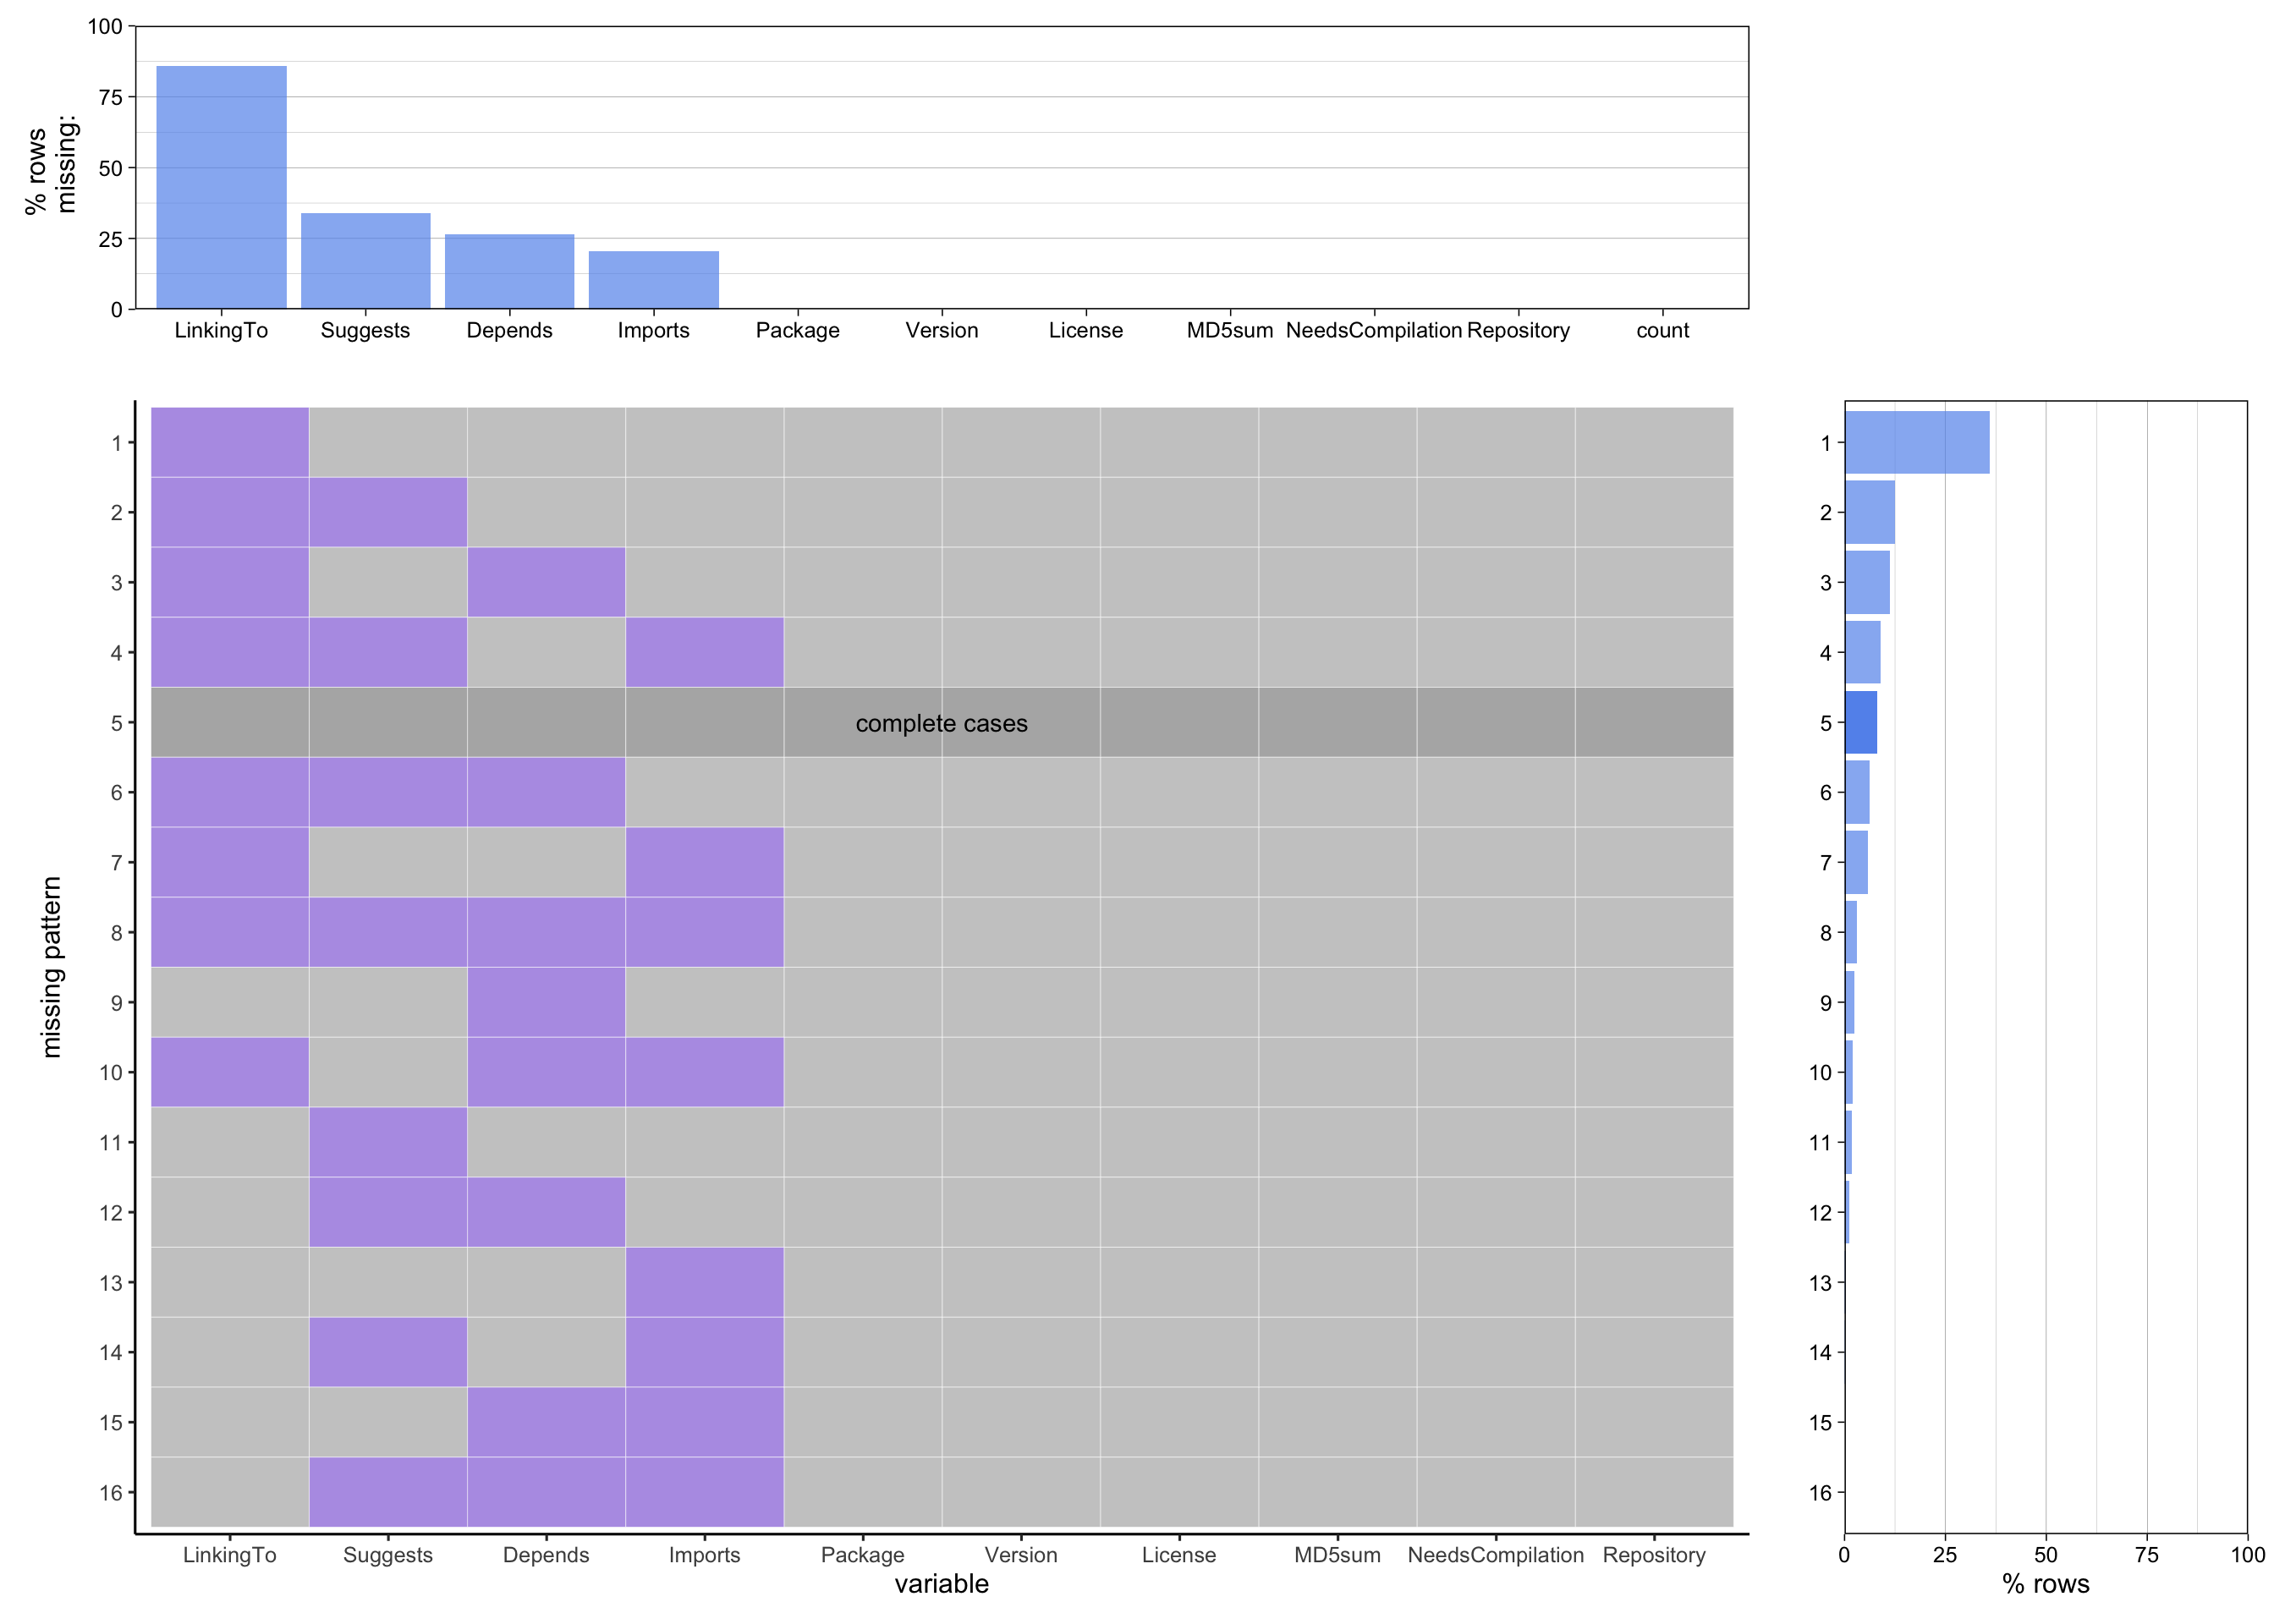
After excluding the previously identified columns, it becomes evident that six columns—Package, Versions, License, MD5, NeedsCompilation, and Repository—contain no missing values. Notably, the LinkingTo column, which signifies that the current package links to additional packages necessary for compilation or linking, has over 75% of its rows missing.
Furthermore, two prevalent patterns emerge: the absence of both LinkingTo and Suggests, and the absence of both LinkingTo and Depends, each accounting for approximately 10% of the dataset. In this context, “Suggests” refers to other R packages recommended for additional features but not essential for basic functionality, while “Depends” indicates other R packages critical for the core functionality of the package.
This observed pattern is logical, as it underscores the nature of package dependencies. If a package doesn’t necessitate dependencies for its fundamental operations, it’s reasonable to assume that additional functionalities, such as those suggested or depended upon, would also not require additional dependencies.